Degradation fit
Using the single species model, we fit in this example the reaction constant \(k_{\mathrm{reac}}\) to experimental data.
With pdom.config we can create example_reac_fit.ini.
The parts which require user input are highlighted in yellow.
$ pdom.config
ID of the system (avoid spaces): example_reac_fit

Should data be fitted to the simulation?
	1: fit
	2: just simulation
Your choice: 1

What kind of experiment was conducted?
	1: Adsorption-Desorption
	2: Degradation
	3: TOC
Your choice: 2

How can you identify the initial molecule?
	1: chemID (https://pubchem.ncbi.nlm.nih.gov)
	2: name
Your choice: 1
Molecule: 2764
Found ciprofloxacin (C17H18FN3O3)

What is the catalyst concentration?
  the allowed unis are: g/m^3, g/L, mg/L
Value: 1.0 g/L

What is the catalyst surface area?
  the allowed unis are: m^2/g, cm^2/g
Value: 56 m^2/g

What is the overall volume?
  the allowed unis are: m^3, L, cm^3, mL
Value: 1 L

How long should the simulation be?
  the allowed unis are: h, min, s
Value: 0.8 h

Which constant is known?
	1: k_ads
	2: k_des
Your choice: 1

What is the adsorption constant?
  the allowed unis are: m/s
Value: 3.7E-8 m/s

What is concentration in the solution?
  the allowed unis are: molecule/m^3, molecule/L, mol/m^3, mmol/L, M, mol/L, mo/mc, g/L, mg/L, g/m^3
Value: 3.8 mg/L
The resulting file example_reac_fit.ini is now in your working directory.
Next, the experimental data needs to be stored as example_reac_fit.json.
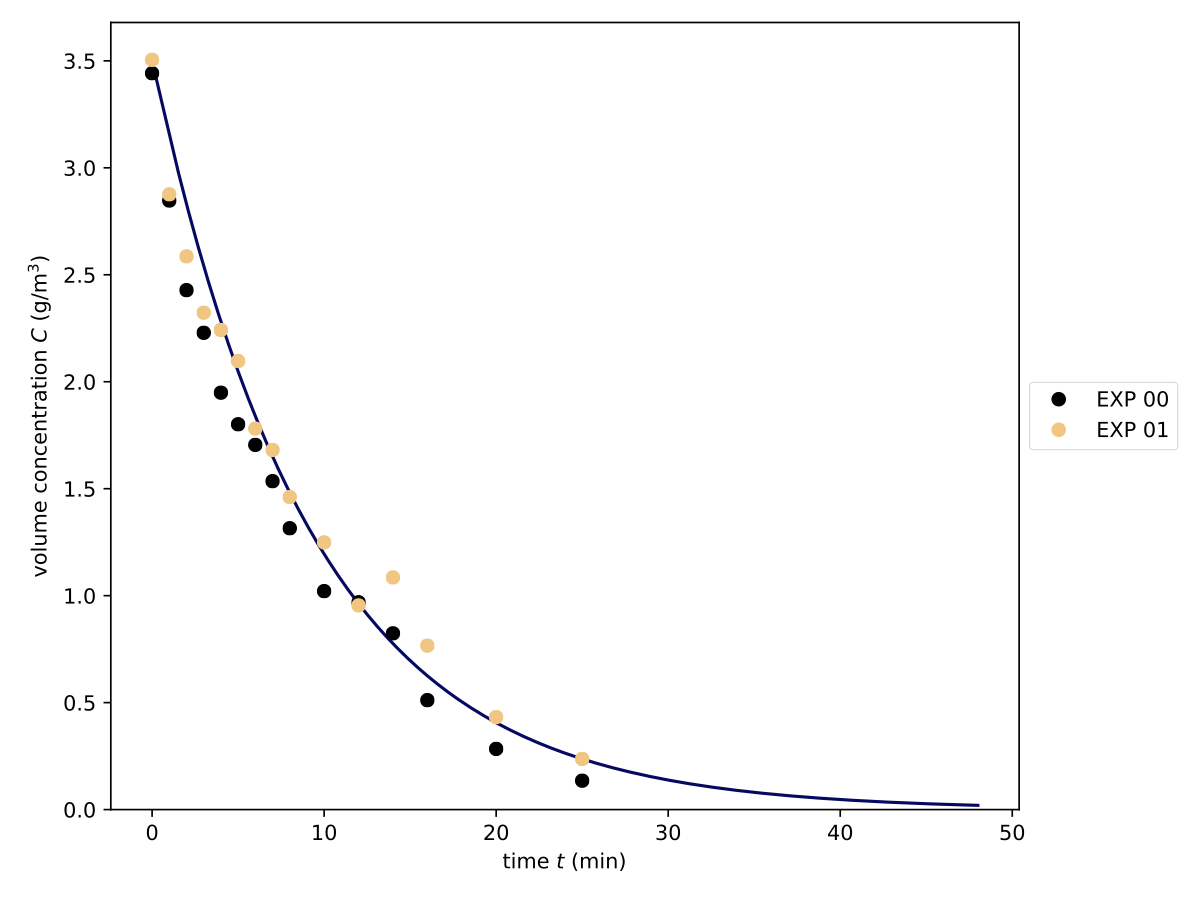
In this example, two time series with the same initial concentrations are used.
{
  "time_series": [
    [
      [0, 1, 2, 3, 4, 5, 6, 7, 8, 10, 12, 14, 16, 20, 25],
      [3.442, 2.847, 2.428, 2.229, 1.949, 1.801, 1.705, 1.535,
        1.315, 1.021, 0.9690, 0.8238, 0.5114, 0.2839, 0.1353]
    ], [
      [0, 1, 2, 3, 4, 5, 6, 7, 8, 10, 12, 14, 16, 20, 25],
      [3.505, 2.876, 2.586, 2.323, 2.242, 2.097, 1.781, 1.681,
        1.461, 1.249, 0.9543, 1.0852, 0.7665, 0.4324, 0.2368]
    ]
  ],
  "time_series_meta": [
    {
      "unit": "min",
      "type": "t"
    }, {
      "unit": "mg/L",
      "type": "solution"
    }
  ]
}
With both files prepared pdom can be started.
$ pdom example_reac_fit.ini --data example_reac_fit.json
Start fitting to data from reaction experiment.
Fit finished after 24 iterations.
    k_ads: 3.700E-08 m/s
    k_des: 2.180E-02 1/s
    k_reac: 1.452E-01 1/s
    error: 3.136E+00
Results saved in <your_working_dir>/example_reac_fit
The result of the fit is stored under <your_working_dir>/example_reac_fit/fit_single.json.
{
    "k_ads": "3.700E-08 m/s",
    "k_des": "2.180E-02 1/s",
    "k_reac": "1.452E-01 1/s",
    "error": "3.136E+00",
    "iterations": 19
}
In the same folder, you find the raw data files with corresponding units.
The saved plot shows the concentration development over time compared to the experimental results.